Data, tables and charts
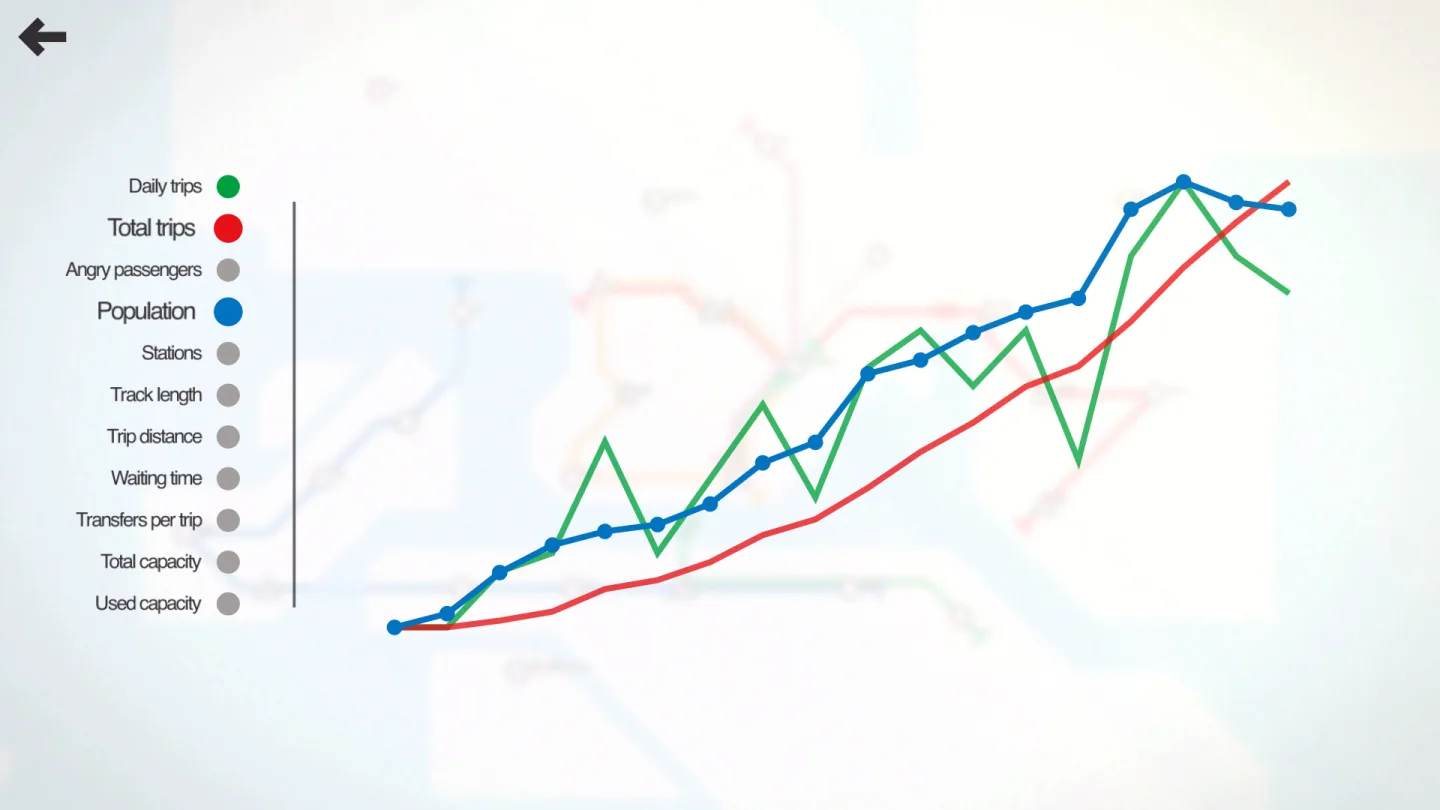 Several data series share one time axis
Mini MetroMini Metro: charts show results changing over days
- Several data series share one time axis
The learner collects observations, represents them in a table or chart and uses differences, trends and relationships to solve a task.
Design tips
- Link each chart point to a measurement and unit.